Jev models make agents faster. Hooked control planes steal the difference.
A five-layer hook chain keeps a tenth of what system-one judgment earns, no matter how fast the next model gets.
Abstract
In August 2026 a frontier model call took seconds, and a control check that cost a few hundred milliseconds was noise beside it. By October, small classifiers make many of the same judgments in tens of milliseconds.
But the control stack that enterprises assemble for agents didn’t get faster at all. It’s often acquired as five layers from five separate vendors (runtime, control, observability, governance, and orchestration) and joined by hooks, which are network calls. A model of that chain built from published network and vendor latencies gives a median of 115 ms when every vendor runs in the customer’s cloud region and 450 ms when they are reached as public SaaS, with p99s of 318 ms and 993 ms.
In both cases the check costs more than the judgment it checks. This note calls that the crossover.
Crossover matters because agents got faster. An agent that sends some of its turns to fast calls finishes sooner, and a fixed control cost on every turn then behaves as the serial fraction in Amdahl’s law. A fixed control cost caps the speedup that faster judgment can deliver and claims a growing share of the agent’s time as more turns go faster.
A public-SaaS hook chain keeps about 10% of the speedup that in-path control allows, however slow the frontier call it replaces: moving every turn from a 60s call to a 50 ms call yields 121-fold rather than 1,200-fold. Making the fast call ten times faster again moves that ceiling only from 121 to 133. The cost falls on the agents whose engineers moved the most judgment off the frontier model, which is a perversion of incentives.
This note argues that
- a control decision has to complete inside the time-envelope of the action it governs. After the crossover a five-layer stack can’t meet that condition, physically.
- latency is the lesser half of the problem. The controls worth having join data that the five layers hold separately, and in a five-layer stack those joins aren’t slow, they’re just never built. In some sense, they are NaN-slower.
- an integrated platform can make the joins, but few if any of them will host their competitors’ agents.
Speed in the path of the action, one place that holds all the state, and neutrality among vendors are therefore jointly required, and no existing arrangement provides all three.
TLDR
- While agent judgment took seconds, control could take hundreds of milliseconds without anyone minding. (§1)
- Small classifiers now make in-turn judgments in tens of milliseconds, so control has a budget it didn’t have before. (§2)
- A chain of five hooked layers costs about 115 ms at the median in region and about 450 ms over public SaaS, and its tail compounds with every layer. (§3)
- Agents that route some of their turns to fast calls are faster, and a fixed control cost per turn is the serial fraction in Amdahl’s sense. A public-SaaS hook chain keeps about a tenth of the available speedup, however slow the frontier call, and faster judgment beyond that point buys almost nothing. The cost lands on the agents with the most fast turns. (§4)
- The per-turn crossover is past. The fleet crossover has two thresholds. At 50% fast turns a governed agent’s median turn is mostly control, under no assumption beyond the measured latencies. Its wall time tips at a fast-turn share set by the slow call: 99.3% at 60 s, 58% at 1 s. Dates follow only from an assumed routing path: a cohort going from 90% to 99% fast turns in a year crosses the public-SaaS chain at the end of 2027 and the in-region chain in mid-2028, and a year later if the climb takes two. The stack is turned off before it is replaced. (§5)
- A check that returns after the act is a record of the act, not a control over it. To govern, a control must be invoked on the path of the action, finish before the action’s effect, and take a small fraction of the action’s own time. (§6)
- The most valuable controls need data from several layers at once. In a five-layer stack those joins don’t arrive late. They don’t exist. (§7)
- An integrated platform can make the joins but can’t be neutral among vendors’ agents. The requirement is the conjunction: in the path, unified, and neutral. (§8)
1. Agent controls aren’t cheap any more
Until recently an agent’s turn was dominated by its model call. Frontier calls are slow and their distribution is long-tailed. Across all traffic through its gateway in April 2026, Requesty measured a p50 end-to-end latency of 5.8 s and a p95 of 52.6 s for Anthropic, 2.5 s and 17.9 s for OpenAI, and 13.7 s and 115.2 s for Claude on Vertex, a tail it attributes mainly to agentic coding workloads.
Those figures include trivial calls. A measured distribution sharpens them: across 665,453 Claude Code and Codex calls logged in TraceLab v0.0.2, the per-call p10 is 1.9 s and the median 6.3 s, and calls that carry substantive generation are slower: a median of 27.9 s for calls producing a thousand or more output tokens, 46.7 s at two thousand or more, with p95 at 108 to 147 s and p99 past 280 s (Zhu et al. 2026). The calls that dominate an agent’s elapsed time sit in the tens of seconds to minutes, which is consistent with the measured tails and with Artificial Analysis’s reports of complete responses measured in minutes for the highest-effort configurations. Against a call of that length, a guardrail service that added two or three hundred milliseconds changed nothing a user could notice.
Practitioners have a rule for when that stops being true. O’Connor, reporting on six guardrail tools run inline on a production agent, puts it as follows: inline checks past about 50 ms are felt by users, and past about 200 ms someone turns them off during an incident. The rule was rarely tested while the model call dwarfed everything around it.
So the hook is the dominant integration pattern for agent control:
- Each layer exposes a callback, and
- the agent or its harness calls it before or after a step: to ask whether a tool call is allowed, to log what happened, to charge a budget, to check an output.
- in the limit case, each layer is a separate product, usually from a separate vendor, reached over a network.
The dominant pattern was reasonable because it was cheap relative to what it controlled.
2. Judgment got fast
The judgments that control depends on are narrow. Is this input an injection? Does this output contain personal data? Is this tool call within the task’s scope? None of them requires a frontier model, and in September 2026 a class of model built for exactly this shape of question arrived. TypeSafe AI’s Jev, released on 15 September, returns a typed decision, a choice among options, a score, or a yes or no, rather than text, and its vendor claims it answers such questions “40x-200x faster for the same levels of frontier intelligence” (Almeida 2026). The vendor’s end-to-end figure is 70 to 500 ms, measured from laptops on the West Coast, with no percentiles. Three weeks later a16z, announcing its investment, reported a trillion tokens served in the first three days and a quarter of the Fortune 500 integrated, and named the effect: “make intelligence cheap enough to call anywhere, and it gets called everywhere” (Andreessen Horowitz 2026).
Independent measurement followed within the week. this-that-model-1.0, an open 2B-parameter decision model, makes a decision in 30.9 ms on one laptop GPU against 8,758 ms for the frontier call it replaces (Cheng, Dai, and Sun 2026). A survey of public GitHub projects counted 2,170 that called Jev by 22 September (Ling, Xue, and Ye 2026). REFLEX puts a system-one model in front of the strong model as a selective control layer and removes 72.7% of strong-model calls at 95% task success (Wu and Lim 2026). The questions control asks are the questions these models answer.
The fast tier existed before September in narrower form. Meta’s model card for Prompt Guard 2 reports 19.3 ms per classification for the 22M model and 92.4 ms for the 86M model, on an A100 with 512-token inputs, and vendor summaries describe the same tiers more loosely: single-digit milliseconds for pattern checks, tens of milliseconds for small classifiers, and hundreds of milliseconds to seconds for a judge model that rereads the context. Those summaries publish no method, and this note uses them only as a description of tiers. What changed in September is that the fast tier stopped being a set of special-purpose classifiers and became a general interface, and engineers began routing judgment through it.
WunderOS’s own in-path scorer is a model of this class. It’s the neural model that decides what the context window keeps (PLRN-022), and it measures 89 ms on a fresh input and 12 µs on a cached one. The admission decision, the control gate every piece of work passes before it starts, measures 142 µs at p99. Both are measured on master; the run identifiers are in the method note.
The fast call this note models, \(J_f\) = 50 ms in §4, is an open system-one model served in the customer’s region or on the box, not the hosted endpoint. A decision fetched over the public internet costs what §3 charges for one hook, and the one public Jev-backed tool gate for a coding agent, pi-jev, reports about 300 ms per round trip. No independent percentile for the hosted service has been published, and this note quotes none.
Figure 1 shows what follows. The cost of a judgment, as measured in latency bands, fell by about two orders of magnitude between August and October, and most of it came in September. The control around it stayed where it was.
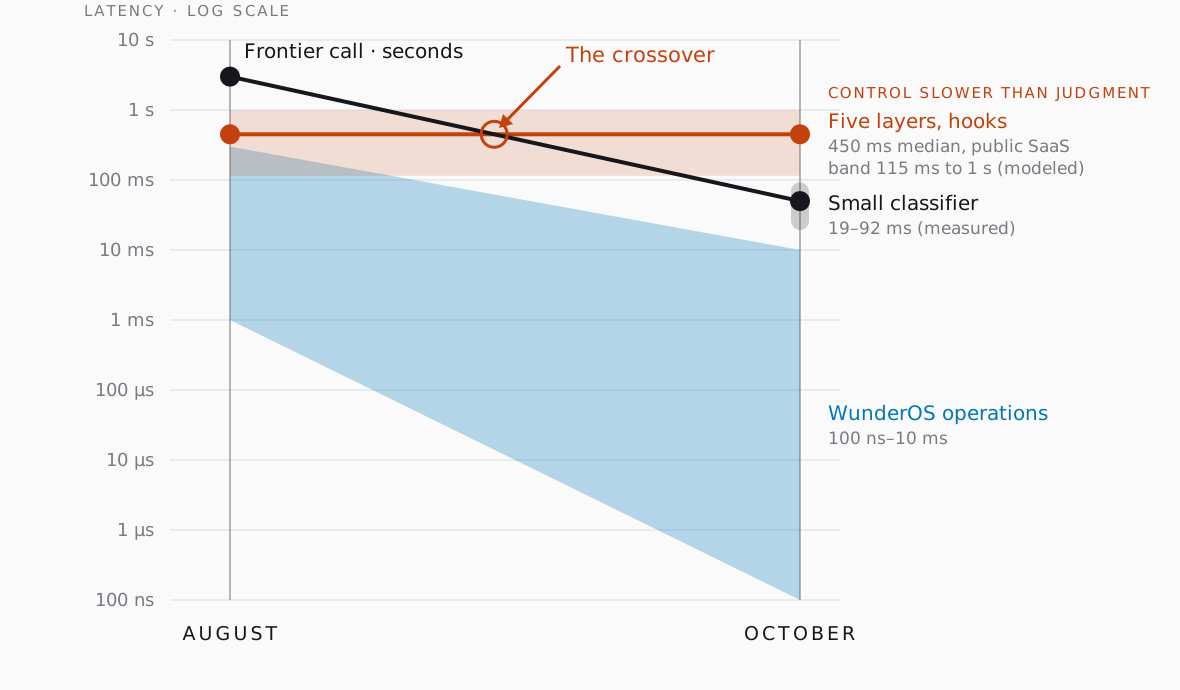
Figure 1. The crossover. Judgment latency (dark line) falls from a short frontier call of about three seconds in August, near the p10 for non-trivial work, to a system-one decision in October: 30.9 ms for an open 2B model on a laptop GPU (Cheng, Dai, and Sun 2026) and 19–92 ms for Prompt Guard 2 (22M and 86M). The five-layer hook chain (orange) doesn’t move. Its band runs from the in-region p50 to the public-SaaS p99 of the model in §3, and the line marks the public-SaaS median. The blue region is the range of WunderOS operations; its October edge is measured on master. Log scale.
3. What a hook chain costs
The figure’s orange band is a model, and the model is stated here so that it can be checked and replaced with a measurement.
The chain. A governed action passes through up to five layers.
- Each layer is a separate service, and each call costs one network round trip plus the service’s own processing.
- The calls run in sequence, because each layer needs the previous layer’s output: governance needs the grant that control resolved, and the record needs both.
- A final step correlates the five answers, which share no common run or grant identifier. Every component is drawn from a lognormal distribution, the usual shape for service latency.
The parameters.
- For vendors deployed in the customer’s region, the round-trip median is 1.5 ms, which is the cross-zone p50 that AWS reports from ping tests in three regions (Haken).
- For vendors reached as public SaaS, it is 30 ms, an assumption.
- Processing has a median of 15 ms in region and 40 ms over SaaS, with a p99 eight times the median.
The SaaS figure is anchored to Lakera’s published p95 for its SaaS endpoint: under 20 ms for a 1,000-character input, 100–200 ms at 10,000 characters, and 300–400 ms at 30,000. An agent’s turn, with its tool results and history, commonly runs past 10,000 characters, so 40 ms is a conservative median for a check that reads it. Correlation costs 5 ms in region and 10 ms over SaaS, which are very generous estimates.
| Deployment | p50 | p90 | p95 | p99 | p99.9 |
|---|---|---|---|---|---|
| All five vendors in the customer’s region | 115 ms | 195 ms | 230 ms | 318 ms | 481 ms |
| All five vendors as public SaaS | 450 ms | 666 ms | 759 ms | 993 ms | 1,431 ms |
An earlier, back-of-envelope guesstimate of 500 ms for such a stack, made without a model, turns out to be close to the public-SaaS median rather than a tail value.
Sensitivity. The result depends most on vendor processing time. The most favorable case tried, with every vendor in region, a 5 ms processing median, and a tight tail (p99 at four times the median), gives a p50 of 43 ms and a p99 of 78 ms.
That is still above Prompt Guard 2 22M’s 19.3 ms, and it approaches the 86M model at its tail. Against a check made in process in microseconds, the gap at the most favorable setting is three to four orders of magnitude.
| Round trip | Processing median | p99 ÷ median | Chain p50 | Chain p99 |
|---|---|---|---|---|
| In region | 5 ms | 4× | 43 ms | 78 ms |
| In region | 15 ms | 8× | 115 ms | 317 ms |
| In region | 40 ms | 8× | 282 ms | 822 ms |
| Public SaaS | 5 ms | 4× | 207 ms | 325 ms |
| Public SaaS | 40 ms | 8× | 450 ms | 998 ms |
The tail compounds. When five calls run in sequence, the chance that at least one of them lands at or beyond its own p99 is \(1 - 0.99^5\), about 4.9%. One governed action in twenty pays a full vendor tail.
Dean and Barroso described the parallel case: a request that fans out to 100 servers, each with a 10 ms typical response and a one-second p99, takes more than a second 63% of the time, and in a measured Google service the p99 for one leaf was 10 ms while the p99 for all leaves was 140 ms.
A sequential chain is the serial analogue. Latencies are additive, and tail exposure compounds.
Running the calls in parallel doesn’t help. The layers depend on each other’s outputs, so most of them can’t be issued together. Where they can, a fan-out waits for its slowest member, which is Dean and Barroso’s point. And a hook made asynchronous to save time no longer governs anything, which is the subject of §6.
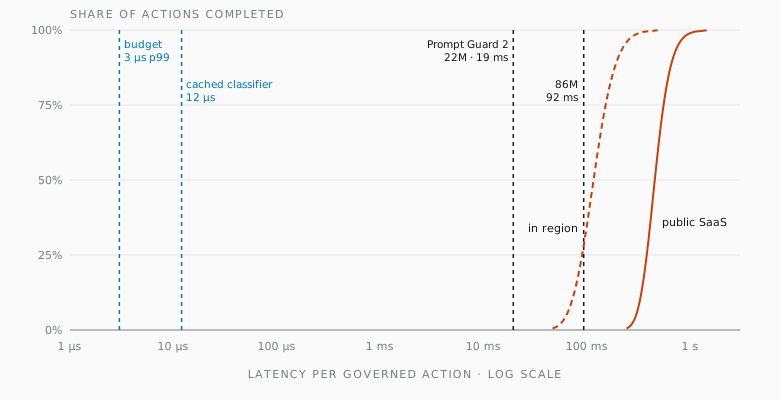
Figure 2. The hook chain as a distribution. Cumulative share of governed actions completed by a given latency, for the two deployments in the table above (10⁶ simulated actions each). Both curves lie wholly to the right of the 22M classifier, both medians lie to the right of the 86M classifier, and every point is three to five orders of magnitude to the right of WunderOS’s in-path decisions.
4. Control is the serial fraction
The crossover would be merely a curiosity if agents themselves hadn’t changed; agents have changed. An agent that sends some of its turns to a small model, a distilled classifier, or a deterministic gate finishes those turns in tens of milliseconds instead of a minute. The agent as a whole runs measurably faster. The latency cost of the control around each turn didn’t change, which makes control the part of the agent that faster judgment can’t touch.
Per Amdahl, in an agent governed through hooks, the unaccelerated part is control. If a fraction \(p\) of a computation is made \(s\) times faster, the whole runs \(1 / ((1 - p) + p/s)\) times faster, and however large \(s\) becomes, the speedup never exceeds \(1 / (1 - p)\). The part left unaccelerated sets the ceiling.
The model. A turn costs its judgment plus its control. A slow turn’s judgment is a frontier call of \(J_s\), taken here as 60 s, a round figure above the 46.7 s median of §1’s heaviest generation class rather than the median of all calls. A fast turn’s is \(J_f\) = 50 ms, the middle of the measured classifier range in §2. A fraction \(f\) of turns is fast. Control costs \(C\) per turn whatever the judgment cost, because the hook chain does the same work either way.
Hence, the mean turn and the speedup over an agent with no fast turns is given by
\[T(f) = (1-f)\,J_s + f\,J_f + C \qquad S(f) = \frac{J_s + C}{T(f)}\]and as \(f\) approaches 1 the speedup approaches its ceiling, \((J_s + C) / (J_f + C)\). The table takes \(C\) from §3: the in-region and public-SaaS medians of the hook chain, and an in-path decision of 12 µs, the warm cost of WunderOS’s context-window scorer.
| Fast turns | Speedup, in-path control | Speedup, in-region hooks | Control share | Speedup, public-SaaS hooks | Control share |
|---|---|---|---|---|---|
| 0% | 1.0× | 1.0× | 0.2% | 1.0× | 0.7% |
| 10% | 1.1× | 1.1× | 0.2% | 1.1× | 0.8% |
| 50% | 2.0× | 2.0× | 0.4% | 2.0× | 1.5% |
| 90% | 9.9× | 9.8× | 1.9% | 9.3× | 6.9% |
| 99% | 92× | 79× | 15% | 55× | 41% |
| 100% | 1,200× | 364× | 70% | 121× | 90% |
Four things follow from this analysis, only the last of which depends on how slow the frontier call is.
- The hook chain keeps a fixed fraction of the available speedup. The ceiling with hooks, divided by the ceiling with in-path control, is close to \(J_f / (J_f + C)\). The in-region chain keeps about 30% of the attainable speedup and the public-SaaS chain about 10%, whether the slow call takes 3 s, 60 s, or 180 s. With 60 s slow turns the ceilings are 1,200× in the path, 364× in region, and 121× over SaaS.
- The fast turns are mostly control. On a single fast turn, control is 70% of the elapsed time in region and 90% over SaaS. An operator reading the trace of such a turn sees an agent that spends most of its time waiting to be told it may proceed.
- Faster judgment stops paying. Once \(J_f\) is small beside \(C\), gains in the fast path barely move the ceiling. Cutting the fast call from 50 ms to 5 ms raises the SaaS ceiling from 121× to 133× and the in-region ceiling from 364× to 501×. With in-path control the same cut raises it from 1,200× to 12,000×. An enterprise that distils its agents’ frequent judgments into small models, or routes each step to the cheapest sufficient mechanism (PLRN-022), creates a speedup that its control stack then wastes.
- The cost concentrates in the agents that have been optimized most. With 60 s slow turns, the remaining slow turns dominate the agent’s time until nearly all turns are fast, so a hook chain is invisible at the agent level for an agent with a tenth or even half of its turns fast: control is under 2% of its time either way. The chain’s share rises steeply only at the end, to 41% at 99% fast turns and 90% at all of them. The agents that pay are the ones whose builders did the most to move judgment off the frontier model, which is the direction every cost and latency incentive points.
The table’s control shares can be priced directly. Li (2026), analyzing logged agent sessions, measures an hour of continuous agent activity at $15.50 to $18.19 for workloads under Codex and $24.34 to $50.16 under Claude Code, takes $30 per agent-hour as a round reference, and finds the sessions whose contexts pass half a million tokens at $38.99 to $104.75 an hour. Those rates price the agent’s activity, so a control that claims a share of the agent’s time taxes each hour at the same rate. Against the $30 reference hour, the in-region chain’s 15 to 70 percent is $4.50 to $21, and the public-SaaS chain’s 41 to 90 percent is $12.30 to $27, rising past $90 against the longest-context sessions. The rates are quoted per adjusted hour of activity, so the waiting a chain adds is not billed by the API. It is paid anyway, in tasks the hour might have held.
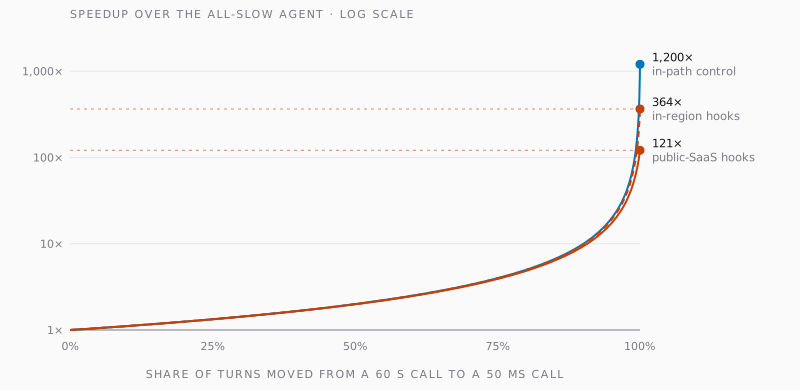
Figure 3. Control is the serial fraction. Speedup of an agent as a growing share of its turns moves from a 60 s frontier call to a 50 ms call, under three per-turn control costs. The curves agree until most turns are fast, then separate: in-path control leaves the full gain available, while a hook chain flattens toward a ceiling set by its own latency, marked by the dotted lines.
Two qualifications make the picture worse, not better.
- The table uses the medians of the hook chain; with its tail the ceilings fall further.
- And it charges one pass through the chain per turn. Measured on the 665,453 logged calls of §1, a round carries one governed action at the median and 1.12 on average; the three-call turn used for the sensitivity is a 95th-percentile structure, not the median one. Under a public-SaaS chain the measured mean structure moves the ceiling from 121× to about 110×, and the three-call tail to 44×.
Under a fixed control cost per turn, the speedup that faster judgment can deliver is bounded by \((J_s + C) / (J_f + C)\). A hook chain keeps roughly \(J_f / (J_f + C)\) of what in-path control allows, and it takes the rest from exactly the agents that were optimized most.
This is the practical form of the crossover. The agents got faster, and the speed gets soaked up by the control stack.
Why this is worse than it seems
You might think 121-fold or even 44-fold speedup is fast enough. Three facts suggest otherwise.
- The ceiling is computed at the chain’s median with one governed action per turn (the measured median structure: 1.12 per round on average), and even at the measured 95th-percentile structure of three governed calls per turn it is 44-fold; at the chain’s p99 each fast turn waits about a second.
- It is also final: the architecture that delivers 121-fold today delivers 133-fold after the next tenfold gain in judgment.
- A control that costs 90% of every fast turn is a control that gets switched off; the observed response to checks past 200 ms is that someone disables them during an incident (§1).
The choice is not between 121-fold and 1,200-fold. It is between agent controls that survive the agents an enterprise deploys and controls that don’t.
A simulator of agent and control latencies
The simulator below runs the same model. It opens on an agent with 99% of its turns fast. Move the control cost between the presets, then make the fast call faster and see how little the result changes.
Simulator
Make the judgment faster. Watch where the time goes.
This agent speeds up
55×
With in-path control
92×
Speedup kept
59%
5. When the stack gets turned off
Sections 3 and 4 are written in the present tense intentionally. Per turn, the crossover is already behind us in the limit case: the public-SaaS chain’s median of 450 ms exceeds an 86M classifier’s 92.4 ms, and even the all-in-region chain’s 115 ms exceeds the 22M classifier’s 19.3 ms, so the check already costs more than the judgment it checks.
What remains in the future is the fleet crossover, the point at which control costs a governed agent more of its time than judgment does. It has two thresholds, because an agent’s turns have a median and a mean, and the two part company exactly where the hook chain bites.
The first threshold is the median turn, and it needs no assumption beyond the three latencies already measured. Once more than half of an agent’s turns are fast, its median turn is a fast turn, and §4 found that a single fast turn is 70% control in region and 90% control over public SaaS. That holds whatever the slow call costs, and it holds even for the 86M classifier in region, since 115 ms still exceeds 92.4 ms. At 50% fast turns the typical turn of a governed agent is mostly waiting for permission. This is the crossover an operator sees, because an operator reads traces, and traces are made of turns.
The second threshold is the agent’s wall time, which is what a throughput figure or a bill records. Its timing reduces to one quantity, the agent’s mean judgment time per turn, \(\bar{J} = (1-f)\,J_s + f\,J_f\), since control’s share of the agent’s time is \(C/(\bar{J} + C)\) and control dominates once \(\bar{J} < C\). Solving \(\bar{J} = C\) for the fast-turn share gives
\[f^* = \frac{J_s - C}{J_s - J_f}\]a function of the three latencies and nothing else. The table gives it by slow turn and chain:
| Slow turn \(J_s\) | Public-SaaS chain (450 ms) | In-region chain (115 ms) |
|---|---|---|
| 60 s (above §1’s heaviest class) | 99.3% fast turns | 99.9% |
| 10 s | 96.0% | 99.3% |
| 3 s (§1’s p25) | 86.4% | 97.8% |
| 1 s | 57.9% | 93.2% |
| 500 ms | 11.1% | 85.6% |
The mean is carried by whatever slow turns remain, so at a 60-second slow turn this threshold is a property only of the most-routed agents, which is why §4 found the chain invisible at the agent level for most fleets today even where it already owns their median turn. At a one-second slow turn the threshold is 58%, roughly where well-routed agents already sit. As slow turns accelerate, or are decomposed into fast ones, control-domination stops being the tail’s experience and becomes the fleet’s. Agents reach \(f^*\) by routing, by watching their slow calls shorten, or by both.
Neither threshold carries a date. The traces §1 draws on log frontier calls only, so no cohort’s routed share can be read from them, and the date at which a fleet crosses is the date its routing reaches \(f^*\). What follows is a projection under a stated path, and its dates are the dates the routed share reaches \(f^*\) under that path and no other.
Two levers move \(\bar{J}\), and they move it in the same direction:
- routing more turns to fast calls shrinks the slow term; and,
- faster classifiers shrink the fast term.
The levers are correlated in practice, since the distillation economics that justify routing (PLRN-022) are the economics that pay for faster serving, so a projection that pulls only one lever understates the pace.
This one pulls both:
- Routing. The fast-turn fraction \(f\) rises logistically from 90% at this note’s date to 99% one year later. This is the path, and it is assumed rather than measured.
- Classifier latency. \(J_f\) halves annually from 50 ms, a slower cadence than the two months in which the observed drop was two orders of magnitude. The path presumes what §2 describes: judgments that stay classification-shaped, of bounded input and verdict-length output, or reading a cached prefix. A check against measured serving data is in the method note.
- The slow call. \(J_s\) is held at 60 s, a round figure above the 46.7 s median §1 measured for the heaviest generation class. The projection then owes nothing to frontier calls getting faster; §1’s lighter measured classes (6.3 to 27.9 s) would move every date below earlier, never later.
The scenario starts where the cost does. An agent that already sends 90% of its turns to fast calls is the most-routed cohort of today’s fleet, not its median; §4’s accounting found the hook chain invisible at the agent level for an agent with even half of its turns fast, so it is the cohort at 90% whose agents feel the crossover now and pay for it. The dates that follow are the dates the crossover reaches that cohort if the path holds, which is to say the dates the abandonment of the stack begins.
The mean judgment time of such an agent falls from about 6 s at this note’s date to 625 ms one year later, crosses the public-SaaS chain’s 450 ms at the end of 2027 and the in-region chain’s 115 ms in the middle of 2028. Even a slow call that tripled to 180 s, which no latency trend suggests, delays the SaaS crossing by only about five months, because most of the mean is by then carried by the few remaining slow turns.
The rest of the fleet walks the same path to the same threshold. A cohort that begins at 50% fast turns today and climbs at the same rate crosses the public-SaaS chain at the start of 2029 and the in-region chain by the autumn of 2029, about a year behind. If by then its remaining slow calls have shortened to 10 s, its crossings fall instead in the spring and the autumn of 2028.
What moves these dates is the path, and almost nothing else. The same leading cohort taking two years rather than one to go from 90% to 99% crosses the public-SaaS chain in early 2029 and the in-region chain in early 2030. Freezing classifier latency at 50 ms, by contrast, leaves the SaaS crossing where it is and delays the in-region crossing by three months. The threshold does not move at all; only the arrival does.
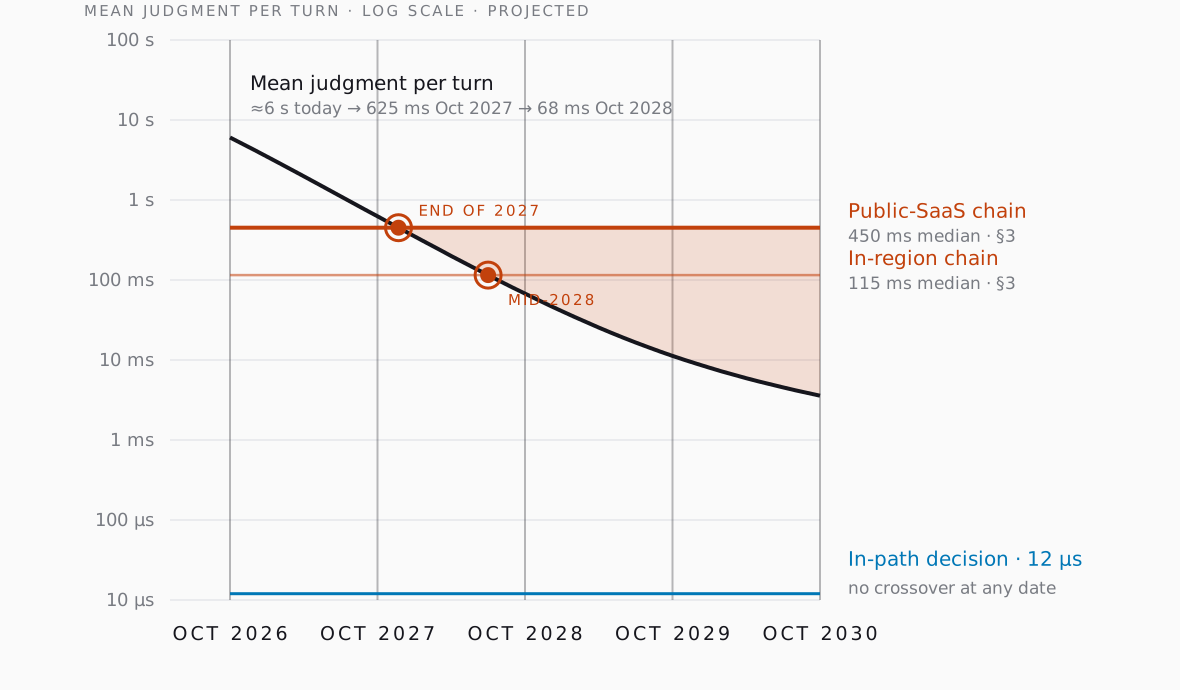
Figure 4. The fleet crossover, projected. Mean judgment time per turn under the path above, which begins with 90% of turns on fast calls and so describes the most-routed cohort; the median fleet crosses the same control lines about a year later (see text). The horizontal lines are the two hook-chain medians of §3. Where the curve falls below a line, control costs the mean governed agent more time than judgment does, and the shaded region is where a public-SaaS hook chain is the slower half of the agent’s life. The dates are conditional on the routing path; the thresholds the lines mark are not. Holding the slow call at 60 s makes the crossings later, not earlier. The blue line is an in-path decision of 12 µs, the scorer’s warm cost, which no plausible judgment trend approaches from above. Source: plrn031_projection.py.
One quantity in the projection depends on neither \(f\) nor \(J_s\). The share of the attainable speedup ceiling that a hook chain keeps is \(J_f/(J_f + C)\), a function of the fast call alone, and at the same annual halving it falls as follows:
| Oct 2026 | Oct 2027 | Oct 2028 | Oct 2029 | |
|---|---|---|---|---|
| In-region chain (115 ms) | 30% | 18% | 10% | 5.2% |
| Public-SaaS chain (450 ms) | 10% | 5.3% | 2.7% | 1.4% |
A turn that makes three governed tool calls multiplies \(C\) by three, which divides the last column by three: by 2029 such an agent under public-SaaS governance keeps under half a percent of the speedup that in-path control allows.
How large a fleet this arithmetic governs can now be estimated from the hardware being built to serve it. Li (2026), reconstructing shipments of high-bandwidth memory, finds the memory shipped during 2025 to 2027 sufficient, once deployed, to run tens to hundreds of millions of concurrent agents on today’s frontier models, and about 1.9 billion on the cheapest benchmarked open model. Working all 168 hours of the week, those agents would supply as many weekly hours of work as 140 to 720 million full-time employees; for scale, the United States has about 100 million knowledge workers. The same study expects demand to trail supply for a time: using a fifth of the central capacity estimate implies $2.6 to $5.3 trillion a year in API-equivalent spending once the hardware is deployed, against roughly $1 trillion in model-developer revenue by the end of 2027 if the recent fivefold annual growth holds.
An abundance of compute does not soften the arithmetic, because the crossover binds latency rather than throughput. Parallel hardware buys more agents. It does not shorten the serial chain inside one agent’s turn, which is where a hook chain’s cost is paid. If anything, the pressure runs the other way: the buildout’s own economics, stated as Jevons’ paradox, require activity to grow as fast as serving gets cheap, and the activity is turns. Each drop in the price of judgment routes more turns to fast calls and shortens the calls, which are this section’s two levers moving together. A fleet with surplus hardware is a fleet pressed to run more agents at higher speed, and the faster the agent, the larger the share of its hour the chain takes.
What a fleet does at that point takes few forms, and the forms differ in how long they last. The first response is operational and precedes all of them: O’Connor’s rule from §1 says that checks past about 200 ms are turned off during an incident, so the crossover announces itself as a switch. What follows the switch divides the fleet.
For an operator no one audits, staying off is an exit, and a common one: the incident’s expedient hardens into practice, and the record of what the fleet did and the account of what it was allowed to do slowly stop describing the same runs. For a regulated or public company this exit does not exist, because the same divergence is a reportable condition with a remediation date, set by statute, audit, and insurer rather than by preference. Such a fleet has two exits.
The first is to throttle: keep the hook chain, restore the checks, and run the agents at hook-compatible speed, paying §4’s ceiling as lost throughput instead of as risk. Throttling is compliant, immediate, and purchasable from incumbent vendors, and those three properties will make it the common first move. It is also the least durable exit. Its price is legible, since §4’s tables state it as a number that a competitor’s fleet beats by an order of magnitude. Its safety is thinner than it looks, since the restored stack still cannot join the record to the budget to the grant, and its controls remain the union of five partial views, the ones §7 names. And it lasts only until it meets a fleet whose agents run at full speed under control that is also fuller: an in-path decision point holds the record, the budget, and the grant together at decision time, so its controls are a superset that the throttle cannot purchase separately. Against such a fleet the throttled operator has traded speed for safety and received neither.
The second is replacement, and its durability is the conjunction of §8. In the path, unified, and neutral, the replacement keeps the speedup and keeps the better controls, the two properties between which throttling pretends there is a trade.
These predictions are falsifiable; their signals are operational rather than declared, and they divide as the exits do.
- Guardrail products will make asynchronous or log-only mode the default.
- Governance stages will go missing from incident postmortems, disabled under load and never restored.
- A governance-tax line will appear in the cost models that agent platforms publish for their customers.
Those are the switches of the unaudited half. The regulated half’s signals are written down somewhere, and so are findable:
- Compensating-control disclosures and audit findings that name agent oversight.
- Procurement of control planes that appeared on no roadmap, completed on emergency timelines.
- Agent deployments announced as throttled out of caution, where the caution is real and the throttle is the hook chain’s.
The question left by the crossover is not whether but when. For the median turn the answer is the day half the turns go fast. For the agent’s hour it is the year routing reaches the threshold, and on the path above that year is 2028.
6. A late control is a record
Anderson’s reference monitor, from his 1972 planning study for USAF, is the classical statement of what a control must be. The mechanism must be
- invoked on every access,
- tamperproof, and
- small enough to verify.
Saltzer and Schroeder’s principle of complete mediation says the same of authority: every access to every object is checked. Both principles are usually read spatially, as a question of whether any path bypasses the check. They also have a temporal reading. A check that completes after the access it was meant to decide was invoked, but it did not mediate, it observed.
The security literature has a name for the interval in between. A time-of-check-to-time-of-use flaw, in Bishop and Dilger’s account, arises when the state a check examined can change before the checked operation uses it. A multi-hop check widens that interval. The five answers in §3 describe the state as it was at five different moments over the 115 to 450 ms it took to gather them, and the agent’s next action may already be under way.
Control theory states the requirement as a ratio. A digital controller must sample and act fast relative to the dynamics of the plant it controls, and the rule of thumb in Åström and Wittenmark’s treatment is several samples per rise time of the plant. WunderOS (see PLRN-004) treats the agent as the plant: a source of nondeterminism with a controller around it. Once the agent’s steps are made in tens of milliseconds, a controller that decides in hundreds of milliseconds isn’t sampling the plant. It’s reading its history.
For a control over an agent’s step to govern rather than record, its decision must be invoked on the step’s path, complete before the step’s effect, and take a small fraction of the step’s own duration.
The first two clauses are Anderson’s and Bishop and Dilger’s. The third is the one the crossover breaks. Before 2026 a five-layer stack met it by default, because the step was a frontier call measured in seconds. Now it doesn’t, and it can’t be made to by tuning, since the cost is in the round trips between products rather than inside any one of them.
7. The joins five layers can’t make
Latency is the visible half of the problem. The other half is that each of the five layers holds only part of what a useful control needs.
Consider a rule that an enterprise could reasonably want: stop this run if it has read personal data, has spent beyond its share of the budget, and acts under a grant that expires today.
The record of what was read lives with the observability vendor, the budget with the orchestration vendor, and the grant with the control vendor. Evaluating the rule means three hops, a join on identifiers the three products don’t share, and a decision that arrives after the run has moved on. In practice such rules aren’t so much slow as simply unwritten. Each vendor offers the controls it can evaluate from its own data, and the enterprise gets the union of five partial views rather than a view of the run.
A single control point that sees every action, holds the state those actions produce, and decides in microseconds makes a different class of control possible:
- Joined controls. Rules over the record, the budget, and the authority together, evaluated at decision time (PLRN-008, PLRN-014).
- Per-step economics. Re-deciding a budget every turn, or sending each step to the cheapest mechanism that preserves the answer, pays only when the decision costs far less than the step it governs (PLRN-021, PLRN-022). The amounts are now measured: logged sessions price an hour of continuous agent activity at $15.50 to $50.16 across Codex and Claude Code workloads, and past $100 at the longest contexts (Li 2026).
- Replay and compensation. Deterministic replay needs every input to a run, and an undo due weeks later needs a holder that outlives the run (PLRN-002, PLRN-011, PLRN-027).
- Information flow. Deciding what a visiting agent may take away needs labels that follow data through every read and write to one egress (PLRN-016).
- Learning from complete traces. Improving a fleet from its own runs needs whole, joined, sealed records rather than fragments in five formats (PLRN-021).
8. Unity without neutrality
An integrated platform solves both halves for its own agents. Databricks, Snowflake, Salesforce, and ServiceNow can each put the layers in one place, and each offers that unity on condition that the agents run on its platform. But enterprises don’t run one platform’s agents. Most buy AI from several vendors, and the agents that escape central control are the ones built outside it.
In Dataiku’s 2026 survey, 81% of 685 CIOs said they lack complete oversight of agents created outside formal channels. Gartner’s analysts recommend platform-neutral guardian agents for unified visibility and active runtime control (Litan et al., May 2026). No platform vendor can be that neutral party with respect to its competitors.
| Arrangement | In the path, in time | One place for the state | Neutral among vendors |
|---|---|---|---|
| Five layers from five vendors, joined by hooks | No, after the crossover | No | Yes |
| An integrated platform | Yes, for its own agents | Yes, for its own agents | No |
| An agent OS | Yes | Yes | Yes |
The three properties are jointly required. Any two without the third reproduce one of the arrangements that already exist and already fail: neutrality and separation without speed is the five-vendor stack, and speed and unity without neutrality is the platform.
What this note doesn’t claim
- That any particular vendor’s stack has the latencies in §3. They come from a model assembled from published components, and the note says how to replace them with a measurement.
- That hooks are useless. An asynchronous hook is good observability. The claim concerns controls that must act before an action’s effect.
- That unification improves agent outcomes. It makes certain controls possible. Whether fleets that use them fail less, or need fewer interventions, is an empirical question this note leaves open.
- That the crossover stays at today’s numbers. If judgment moves into microseconds, as WunderOS’s cached path already has, the argument becomes stronger, because every out-of-process check then exceeds the judgment by orders of magnitude.
How WunderOS answers it
| Requirement | Where it’s met | Measured on master |
|---|---|---|
| Decision in the path of every action | Capability check on every tool call; policy decision point with Rego import; budget re-decided every turn (004, 014, 028) | — |
| Judgment inside the controller | In-path neural scorer and the cheapest sufficient mechanism (022) | 89 ms fresh · 12 µs cached |
| One place for the state | Merkle-sealed log as the database, with a bitemporal index (002, 018, 020) | 1.1–1.8 µs per record, replay p50 |
| Admission before work starts | Six-gate dependency admission (021) | 142 µs p99 |
| Replay of any run | Deterministic replay across both runtimes (002) | 1.17× run time |
| Neutral hosting | Unmodified third-party agents in microVM run places, ring 0 held by the OS (004) | resume 25 ms |
Open questions
- The measurement. A five-vendor stack should be assembled from real products, driven by a realistic agent workload, and timed per layer at p50 and p99. Until then §3 is a model, and its weakest parameter is vendor processing time.
- Which controls must sit in the path. Some controls can safely observe after the fact and act on the next step. A taxonomy of controls by how much delay each tolerates would show where the crossover binds and where it doesn’t.
- The frontier distribution beyond coding agents. §1’s distribution is now measured on logged Claude Code and Codex sessions (TraceLab v0.0.2); equivalent traces for other agent workloads would test whether the same tails hold.
- How the crossover moves. Classifiers will get faster and agent steps will get shorter. Both push the requirement in §6 toward in-process decisions, and the rate at which they do so sets how long out-of-process control remains viable for anything.
Related work
The bound in §4 is Amdahl’s (1967), applied with control as the serial fraction. The tail-latency argument is Dean and Barroso’s (2013), applied here to a serial chain rather than a fan-out. The requirement that a control mediate every access is Anderson’s reference monitor (1972) and Saltzer and Schroeder’s complete mediation (1975); the temporal reading of both draws on the time-of-check-to-time-of-use literature (Bishop and Dilger 1996). The sampling requirement is standard in digital control (Åström and Wittenmark 1997), and the treatment of the agent as a plant under supervision follows Ramadge and Wonham through PLRN-004. Meta’s LlamaFirewall (Chennabasappa et al. 2025) is an example of guardrails composed inside the agent’s own process, which avoids the hook chain at the cost of placing the check where the agent can reach it, the trade that PLRN-028 examines. Gartner’s work on guardian agents (2025, 2026) is the closest analyst framing of the neutrality requirement.
References
- Almeida, D. (2026). Introducing System One models and Jev. TypeSafe AI, 15 September 2026. typesafe.ai/blog/introducing-system-one-models-and-jev
- Amdahl, G. M. (1967). Validity of the single processor approach to achieving large scale computing capabilities. AFIPS Spring Joint Computer Conference, 483–485.
- Andreessen Horowitz (2026). Investing in TypeSafe AI. Li, J., Wang, S., Casado, M., Andreessen, M., and Horowitz, B., 9 October 2026. a16z.com/announcement/investing-in-typesafe-ai
- Anderson, J. P. (1972). Computer Security Technology Planning Study. ESD-TR-73-51, US Air Force Electronic Systems Division. apps.dtic.mil/sti/pdfs/AD0758206.pdf
- Artificial Analysis. LLM leaderboard and benchmarking methodology. artificialanalysis.ai/methodology
- Åström, K. J., and Wittenmark, B. (1997). Computer-Controlled Systems: Theory and Design, 3rd ed. Prentice Hall.
- Bishop, M., and Dilger, M. (1996). Checking for race conditions in file accesses. Computing Systems 9(2), 131–152.
- Cheng, Z., Dai, W., and Sun, J. (2026). this-that-model-1.0: A typed decision model that decides in 30 ms, for a millionth of a cent. arxiv.org/abs/2609.23886
- Chennabasappa, S., et al. (2025). LlamaFirewall: An open source guardrail system for building secure AI agents. arxiv.org/abs/2505.03574
- Dataiku and The Harris Poll (2026). Global AI Confessions Report: CIO Edition. dataiku.com
- Dean, J., and Barroso, L. A. (2013). The tail at scale. Communications of the ACM 56(2), 74–80. research.google/pubs/the-tail-at-scale
- Gartner (2025). Gartner predicts that guardian agents will capture 10–15% of the agentic AI market by 2030. gartner.com
- Haken, M. (2021, updated 2025). Improving performance and reducing cost using Availability Zone affinity. AWS Architecture Blog. aws.amazon.com
- Lakera. Latency benchmark. docs.lakera.ai/docs/latency-benchmark
- Li, J. (2026). How many AI agents could run on the AI chips shipped through 2027? Epoch AI, 2 October 2026. epoch.ai/publications/estimating-the-agent-population
- Ling, G., Xue, M., and Ye, Z. (2026). Jev in the Wild: A data-driven analysis of the Jev model’s functionality, applications and ecosystem. arxiv.org/abs/2609.30216
- Litan, A., Plummer, D., Hollis, M., and Davies, S. (2026). Accelerate AI agent governance and security using platform-agnostic guardian agents. Gartner, 14 May 2026. gartner.com/en/documents/7856181
- Meta. Llama Prompt Guard 2 model card. huggingface.co/meta-llama/Llama-Prompt-Guard-2-22M
- O’Connor, J. (2026). I put 6 LLM guardrail tools inline and measured what they cost me. dev.to
- Ramadge, P. J., and Wonham, W. M. (1987). Supervisory control of a class of discrete event processes. SIAM Journal on Control and Optimization 25(1), 206–230.
- Requesty (2026). Provider latency leaderboard, April 2026. requesty.ai/data/provider-latency-leaderboard-april-2026
- Saltzer, J. H., and Schroeder, M. D. (1975). The protection of information in computer systems. Proceedings of the IEEE 63(9), 1278–1308.
- SemiAnalysis (2026). Claude Code session-tree corpus (WEKA format), cc-traces-weka-062126. Hugging Face, June 2026. huggingface.co/datasets/semianalysisai/cc-traces-weka-062126
- SemiAnalysis InferenceX (2026). AgentX: agentic inference benchmark, methodology and results. inferencex.semianalysis.com
- Wu, T., and Lim, W. Y. B. (2026). REFLEX with Jev for efficient selective control in LLM agents. arxiv.org/abs/2609.26532
- y0usaf (2026). pi-jev: a Jev-backed pre-execution tool-call gate for the Pi coding agent. github.com/y0usaf/pi-jev
- Zhu, K., Jacob, M., Ma, C., Pan, Y., Wang, S., Krishnamurthy, A., and Kasikci, B. (2026). TraceLab: Characterizing coding agent workloads for LLM serving. arxiv.org/abs/2606.30560. Dataset v0.0.2, SyFI Lab, University of Washington, CC BY 4.0.
A note on method
The chain model is a Monte Carlo simulation of 10⁶ actions per deployment (seed 31). Each of the five calls draws a round trip and a processing time from lognormal distributions fixed by a median and a p99-to-median ratio (3× for the network, 8× for processing), and a final correlation step is drawn the same way (6×). The sensitivity table uses 4 × 10⁵ actions per row (seed 7). The cross-zone round trip is AWS’s published ping-test p50; the public-SaaS round trip is an assumption; processing is anchored to Lakera’s published SaaS p95. Frontier-call latencies across all traffic are Requesty’s published April 2026 figures. Classifier latencies are Meta’s published figures. The system-one figures in §2 are the vendor’s own claims (Almeida 2026), which carry no percentiles, the open model’s single-GPU measurement (Cheng, Dai, and Sun 2026), and pi-jev’s reported round trip; none is an independent measurement of the hosted service. The tier descriptions in §2 come from vendor summaries that publish no method and are used only as descriptions. WunderOS figures are measured on master as of this note’s date: the context-window scorer’s 89 ms fresh and 12 µs cached (ADR-083, run 01M3NMV37SEQ55792KHZWQVB1S); admission p99 of 142 µs (ADR-156, run 01M1CKTYS9NJMRYS7GYW0KG2ZQ); log replay p50 of 1.1 to 1.8 µs per record on a cache-resident 8 MiB segment, which the wal_fragmentation scoreboard marks directional; end-to-end replay at 1.17× the original execution on a synthetic cycle (end_to_end_replay_ratio scoreboard, run 01M0ZNS1KGZ0ZZD14CD5S9K90A); and resume of a new VMM through load and resume API completion in 25.3 ms (herberge-hibernation). The per-agent-hour rates in §4 and §7 and the fleet population and spending figures in §5 are Epoch’s published estimates (Li 2026), from its analysis of TraceLab sessions and its reconstruction of high-bandwidth memory shipments. The speedup figures in §4 are computed in closed form from the formula given there, with \(J_s\) = 60 s, \(J_f\) = 50 ms, the hook-chain medians from §3, and 12 µs for in-path control, the context-window scorer’s warm cost. The distributions in §1 and the anchor for \(J_s\) are measured on TraceLab v0.0.2 (Zhu et al. 2026): 665,453 logged Claude Code and Codex calls across 8,058 sessions, September 2025 to July 2026. Call latency is the span of a call’s timing events; turn model time is the sum of call spans within a turn; generation classes are cut by output tokens (≥1,000 and ≥2,000). A turn is Codex’s native turn_id where present, and for Claude rounds, which carry no turn_id, the session’s user-message-count boundary; governed actions per turn \(k\) count the tool calls a round emits, continuation rows included. The extraction’s source is plrn031_tracelab_extract.py, which downloads the pinned release and verifies its checksum before computing. The model’s source is plrn031_chain_model.py. The projection in §5 is closed-form: the fast-turn fraction rises logistically from 90% to 99% over the first year, the fast-call latency halves annually from 50 ms, the slow call is fixed at 60 s, and crossings are located by log-linear interpolation on a monthly grid. The median-cohort path quoted in §5 repeats the calculation with the fast-turn fraction starting at 50% and reaching 90% over the first year, with the slow call at 60 s and at 10 s. The path sensitivities quoted in §5 repeat it with the leading cohort’s climb spread over two years, and with the fast call frozen at 50 ms. The projection’s source is plrn031_projection.py, which also emits Figure 4. The fast-call path was checked against InferenceX’s AgentX serving measurements of August to September 2026. Its endpoint in 2029 implies 640 tok/s/user effective for a four-token verdict; measured serving already exceeds that at concurrency 1 on 2026 silicon (over 700 tok/s/user with single-token prediction, on OpenAI’s Jalapeño), and a classification-shaped call does no decode at all. The path fails only if a fast judgment must read a long context or write a long answer; that is the condition stated in §5.
Appendix A. Agents are bimodal; the expensive ones are long chains
The argument of this note needs only the medians and means of §4, but the traces behind §1 carry the whole distribution, and the distribution is not single-peaked. It is recorded here because the note’s case does not depend on it, and because it is independently load-bearing: any system that admits, budgets, or replays agent turns needs the shape of a turn, not its average, and the shape is this.
Across 57,604 turns in 8,058 logged sessions (TraceLab v0.0.2, Codex and Claude Code), the median turn is one model call. A turn is a user instruction and the cascade it triggers, and 61% of turns resolve in that one call. The remaining 39% are a different animal: a median of 100 s and a p95 of over twenty minutes of model time apiece, chain lengths of 22 rounds at the 90th percentile and 148 at the 99th, the longest measured chain holding 7,786 rounds. Work concentrates in the tail: the mean turn carries 11.2 rounds against the median of one, and the share of total model time spent in multi-round turns exceeds their 39% headcount accordingly.
Percentiles in the last three rows are within the 39% multi-round class.
| Turns | Share of turns | Rounds per turn | Model time per turn |
|---|---|---|---|
| Single-call | 61% | 1 | ≈6 s (all-turn median) |
| Multi-round, below p90 | 29% | 2–21 | 43 s at the class p25 |
| Multi-round, p90–p99 | 9% | 22–147 | 614 s at p90 |
| Top 1% | 1% | ≥148 | 1,261 s at the class p95 |
Governed actions per round are likewise concentrated. Of the 665,453 logged
rounds, 72% emit exactly one tool call, 14% emit none, 6% emit two, and 8%
emit three or more (p99 = 4; the full histogram is in the extraction’s
k_distribution block). A control plane priced per governed action therefore
faces a median round that is cheap and a tail of rounds that multiply its
cost. The ceiling arithmetic of §4 uses the one-call median as its base case
and the three-call structure (≈p95) as its stress case; both are measured
rather than assumed.
The operational consequence is direct. A fleet’s control budget, admission policy, and replay windows cannot be tuned to the mean turn (11 rounds, ~7 minutes) without idling at the median, nor to the median turn (1 round, seconds) without starving the tail that carries the cost. Budget re-decision cadence belongs to the fast single-call turns; admission and replay capacity belong to the hundred-round chains. The distribution above, reproducible from plrn031_tracelab_extract.py, is the distribution to fit.
One level up from the turn is the tree: a main agent and the subagents it spawns, counted as one session. SemiAnalysis’s WEKA corpus (393 Claude Code trees, June 2026) shows the same shape at that level. 45% of trees fan out; those that do carry a median of 4 subagent groups and a median of 233 model calls against 48 for flat trees, and subagent work accounts for 42.5% of all calls logged. The subagent stream is not yet routed to cheaper models (77% of inner calls go to the same frontier Opus as the main stream), but it is already faster per call for a structural reason: shorter jobs, shorter outputs, 5.0 s at the median against the main stream’s 8.3 s. The §5 migration, as it exists today, goes to smaller jobs before it goes to smaller models. The note’s model needs no per-tree restatement: a governed action is governed wherever it sits in the tree, and what fan-out multiplies is the number of governed actions per instruction: §4’s \(k\) one level up. A fan-out tree at the median (233 calls) under a public-SaaS chain pays the §4 ceiling arithmetic not once per instruction but hundreds of times. Tree-level figures are from plrn031_weka_tree_check.py, which pins and checksums the corpus the same way.
Drafted with Claude Opus 5.5.
Kendall Clark · k@pentad.ai
Great Falls, Virginia
14 October 2026